Choosing the 2026 best Atomic Absorption Rayleigh instrument requires more than comparing prices or detector specifications. Laboratory teams should examine sensitivity, wavelength stability, burner design, furnace control, and software reliability. A polished instrument can still produce weak results when samples contain high salt, suspended solids, or complex organic matrices.
Bernhard Welz, a respected authority in atomic absorption spectroscopy, stated, “Good analytical chemistry begins with careful sample preparation.” This principle remains practical today. A technician preparing a copper sample may need acid digestion, filtration, dilution, and matrix matching before measurement. Small preparation errors can shift absorbance readings noticeably. They can also hide contamination.
Real laboratory experience matters.
The strongest instruments usually offer dependable flame and graphite furnace modes, automatic background correction, and clear calibration records. Buyers should check detection limits using certified reference materials, not only manufacturer demonstrations. Lamp lifetime, gas consumption, maintenance access, and local technical support also influence long-term value. These details often receive less attention than dramatic brochure claims.
No instrument is perfect.
Some systems may excel with metals in drinking water but struggle with viscous industrial samples. Others provide excellent sensitivity while demanding more frequent alignment and cleaning. This comparison therefore considers analytical performance, operating cost, usability, service quality, and documented laboratory results. The ranking may not satisfy every laboratory. That is intentional. Instrument selection should reflect actual sample types, staff skills, compliance needs, and future workload rather than fashionable specifications.
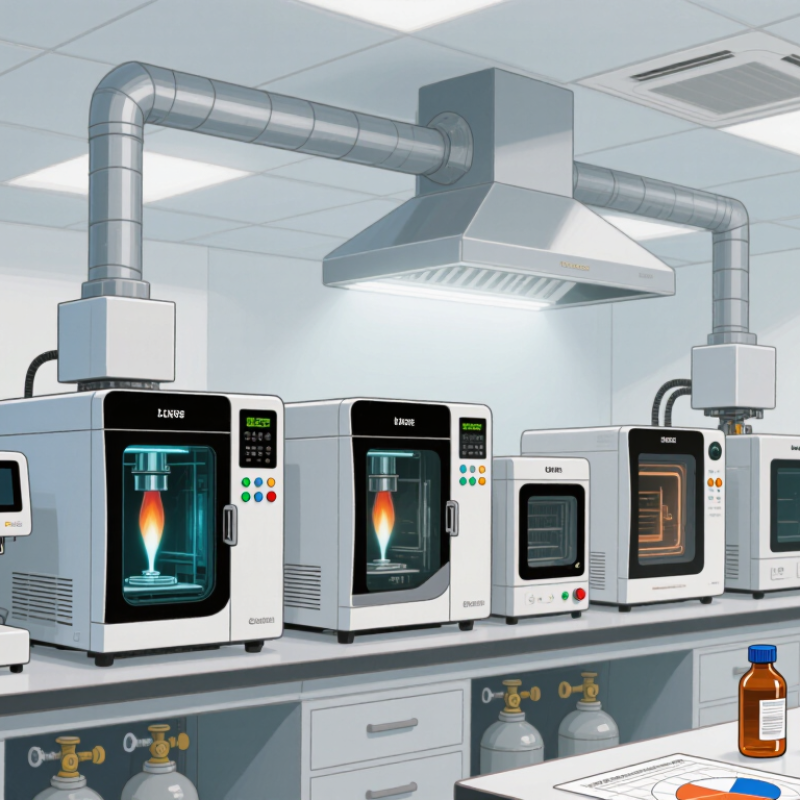
The 2026 best atomic absorption and Rayleigh instruments should match the measurement, not merely the specification sheet. Atomic absorption measures light absorbed by free ground-state atoms. A lamp selects an element-specific wavelength, while a flame or furnace creates the atomic vapor. Most systems operate roughly from 190 to 900 nanometers. Flame methods suit higher concentrations, often milligrams per liter. Furnace methods can reach microgram-per-liter levels, but matrix effects become more troublesome.
Rayleigh scattering measures elastic light scattering from particles, molecules, or density fluctuations. The signal changes with wavelength, particle size, and concentration. It supports aerosol studies, gas analysis, water monitoring, and optical research.
Unlike atomic absorption, it does not identify an element directly. In practice, I compare background correction, detector stability, temperature control, and calibration flexibility. A narrow detection limit can look impressive, yet unstable samples may produce unreliable results. This is where instrument selection becomes less certain.
Tips: Match the atomizer to the expected concentration range. Use certified reference materials and run blanks between samples. Keep cuvettes, burners, and optical windows clean. Check matrix interference before trusting a low reading. I have found that simple maintenance often matters more than an attractive feature list. One limitation remains: Rayleigh signals can overlap with fluorescence or stray light, so independent verification is wise.

Choosing the best atomic absorption instrument in 2026 depends on the detection limit, sample volume, and matrix complexity. Flame AAS is practical for routine metal analysis at ppm levels and some low-ppb applications. It handles larger sample batches with simple operation. However, its sensitivity can weaken when analytes occur at trace concentrations.
Graphite-furnace AAS reaches reliable ppb and sub-ppb detection levels with only a few microlitres of sample. It suits environmental water, biological fluids, and limited-volume digests. The trade-off is slower analysis and greater sensitivity to injection errors. Matrix modifiers, careful temperature programs, and background correction are essential. Rayleigh scattering and molecular absorption may also affect measured signals. No instrument wins every test.
Tips: Match the technique to the real reporting limit, not the brochure value. Use blanks, duplicates, spikes, and certified reference materials. Check recovery after digestion. A clean flame may outperform a complex furnace method for concentrated samples. Conversely, a furnace method can expose contamination that routine preparation hides. I have seen results improve after replacing plastic tubes and extending the rinse step. That detail is easy to miss. Validate precision across several days, because one excellent run proves very little.
Graphite-Furnace AAS generally achieves substantially lower detection limits than Flame AAS because the sample is atomized in a confined graphite tube. The values shown are representative method-level detection limits in parts per billion (ppb); actual performance depends on the element, matrix, wavelength, sample preparation, and instrument settings. Lower values indicate better trace-level sensitivity.
Choosing an atomic absorption instrument requires more than comparing detection limits. Hollow-cathode lamps must match the target element and provide stable, narrow emission lines. A practical system should support rapid lamp alignment, low drift, and automatic current control. Weak lamp output can make a clean spectrum look noisy. That problem is easy to underestimate.
The optical range matters because important analytical lines appear across the ultraviolet and visible regions. The NIST Atomic Spectra Database lists arsenic near 193.7 nm, lead near 283.3 nm, copper near 324.8 nm, calcium near 422.7 nm, and potassium near 766.5 nm. Therefore, 190–900 nm coverage supports a broad elemental menu without frequent optical changes.
Quartz optics, controlled purge, and low stray light are especially valuable below 220 nm, where air absorption and contamination can distort results.
Spectral resolution should be judged with real line pairs, not only a brochure value. Rayleigh-based testing can show whether nearby analytical and interfering lines remain distinguishable. EPA Method 7000B emphasizes wavelength selection, slit settings, background correction, and matrix control for reliable atomic absorption measurements.
In practice, a narrow bandwidth may improve separation but reduce light throughput. I have seen users choose maximum resolution and then struggle with unstable signals. The better decision depends on lamp intensity, sample matrix, and the wavelength actually required.
Performance should be verified with certified reference materials, replicate measurements, and recovery data rather than appearance alone.
For 2026, atomic absorption instruments should be ranked by laboratory evidence, not brochure claims. In accuracy, graphite-furnace systems rank first for trace metals, often reaching low microgram-per-liter or sub-microgram-per-liter detection levels. Flame systems rank higher for routine concentration work, where speed matters more than extreme sensitivity. U.S. EPA Method 7000B uses analyte-specific quality controls, with laboratory control recoveries commonly targeted near 80–120%. That range offers a practical accuracy benchmark.
Throughput favors flame instruments, especially with automated sample introduction. A stable autosampler can process dozens of samples per hour, while furnace analysis usually needs longer drying, ashing, and atomization cycles. Automation ranks third only when software manages dilution, calibration checks, and reruns without constant supervision. ISO/IEC 17025:2017 also emphasizes traceable calibration and controlled records, so unattended operation still needs review. It is not magic.
Operating cost usually ranks flame systems first. They consume more gas, but graphite furnaces use costly tubes, modifiers, and maintenance time. The 2024 MarketsandMarkets atomic spectroscopy assessment projected the broader market to grow from about 6.4 billion dollars in 2024 to 8.5 billion dollars by 2029. That growth reflects demand for faster, more automated elemental testing, not necessarily better accuracy. My ranking is imperfect: a clean water laboratory may value throughput, while a soil laboratory may accept slower runs for lower detection limits. Pilot testing remains necessary.
Brand-neutral comparison of representative atomic absorption system configurations for routine elemental analysis
| Rank | Representative Instrument Configuration | Accuracy Score (25%) | Typical Precision (RSD) | Trace Detection Capability | Throughput Score (25%) | Typical Throughput | Automation Score (20%) | Operating-Cost Score (20%) | Estimated Consumable Cost per Sample | Best-Fit Application | Overall Score |
|---|---|---|---|---|---|---|---|---|---|---|---|
| 1 | Dual-atomizer AA system with flame and graphite-furnace modes | 9.5 | 0.4–1.0% for flame; 1.0–3.0% for furnace | Low µg/L to sub-µg/L range for many elements | 8.7 | 45–80 samples/hour in flame mode; 20–40 samples/hour in furnace mode | 9.3 | 7.2 | Approximately US$2.00–6.00 | Mixed routine and trace-element laboratories | 8.8 |
| 2 | High-throughput simultaneous multi-element flame AA system | 8.8 | 0.5–1.5% | Approximately 1–100 µg/L, depending on element and matrix | 9.6 | 70–120 samples/hour for established methods | 8.8 | 8.3 | Approximately US$1.20–3.00 | High-volume water, food, soil, and agricultural testing | 8.7 |
| 3 | High-resolution graphite-furnace AA system with autosampler | 9.4 | 1.0–2.5% | Approximately 0.01–1 µg/L for many furnace-accessible elements | 6.4 | 18–35 samples/hour, depending on drying and cleaning cycles | 9.0 | 6.8 | Approximately US$3.00–8.00 | Regulated trace metals and low-level contaminant analysis | 8.2 |
| 4 | Automated flame AA system with integrated dilution and burner optimization | 8.4 | 0.6–1.8% | Approximately 2–150 µg/L, depending on element and sample preparation | 8.8 | 55–95 samples/hour | 9.1 | 8.5 | Approximately US$1.00–2.50 | Routine quality control with limited operator intervention | 8.4 |
| 5 | Flame AA system with manual sample introduction and single-element optics | 8.0 | 0.8–2.0% | Approximately 3–200 µg/L, depending on element and matrix | 7.0 | 25–55 samples/hour | 5.8 | 9.3 | Approximately US$0.60–1.80 | Small laboratories and low-to-medium sample volumes | 7.5 |
| 6 | Compact flame AA analyzer for dedicated single-element workflows | 7.6 | 1.0–2.5% | Approximately 5–250 µg/L for common target elements | 6.8 | 20–45 samples/hour | 7.0 | 9.5 | Approximately US$0.50–1.50 | Teaching, process checks, and targeted production control | 7.4 |
| 7 | Entry-level manual flame AA system | 7.0 | 1.5–3.0% | Approximately 10–300 µg/L for suitable elements | 5.5 | 10–30 samples/hour | 4.8 | 9.7 | Approximately US$0.40–1.20 | Basic screening and laboratories with limited sample demand | 6.7 |
2026 Best Atomic Absorption Rayleigh Instruments?
Rayleigh scattering becomes critical when suspended particles are much smaller than the measurement wavelength. Its governing relationship is severe: scattering intensity varies as particle size⁻⁶. A particle twice as large can produce 64 times less intensity under this simplified model. Tiny changes matter.
EPA Method 200.9 recommends filtration practices near 0.45 micrometres for dissolved-element work. That threshold does not remove every colloid or molecular aggregate. ISO 7027-1 also treats turbidity as a light-scattering measurement, supporting careful control of sample clarity. In practical testing, a cloudy digest can raise the apparent signal, especially when the instrument lacks effective background correction.
Experienced analysts should compare filtered and unfiltered aliquots, inspect lamp alignment, and record baseline drift before calibration. Use certified reference materials, not only a blank. A 2024 analytical-instrument market review reported increasing demand for automated quality control and lower detection limits, but market forecasts are not laboratory evidence. That distinction matters.
Rayleigh theory is also imperfect here. Real samples contain irregular particles, dissolved salts, and multiple scattering sources. Particle size⁻⁶ is a guide, not a universal correction. That uncomfortable detail deserves attention. A clean spectrum can still hide preparation errors.
Get in Touch
570 Alden Road Unit #10, Markham Ontario Canada, L3R 8N5
Quick Links
Featured Products
Industries